Wow!
What a night. What a cycle. What a winning streak.
The National Democracy Winning Streak
What started last August in Kansas, then continued into last November in states around the county (including flipping the Michigan and Pennsylvania statehouses), then rolled into April in Wisconsin and August in Ohio…peaked Tuesday with wins across the country:
The big Ohio win on Issue 1
The surprising sweep of the Virginia House and Senate
The victory of a pivotal open seat on the Pennsylvania Supreme Court
Unexpected gains in New Jersey
The robust reelection of Kentucky Governor Andy Beshear
A competitive Mississippi Governor’s race
And a defiant rejection of extremist school board candidates in so many communities (70% of the ones we had identified in Ohio lost)
And don’t forget—we’ve built this entire winning streak in election years when (because Democrats control the White House) the historic pattern suggested that we would be losing most of these races. As a statewide candidate in 2010 and 2014, trust me, I’ve felt the pain of that pattern!
So we are defying history with these wins.
Something is happening. Something big. Something historic.
I won’t get into all the details here (I write about them extensively in my books), but when two factors come together, success follows:
As the far right, in a gerrymandered bubble, spins further into toxic extremism and anti-democracy/anti-freedom tactics, the real-world, personal impact of that extremism and those tactics is becoming more clear to everyday Americans (through, for example, extreme abortion bans or book banners in schools). This is opening up an enormous opportunity for those who represent mainstream positions/values and who support democracy and freedom;
And when those who represent mainstream values and who cherish democracy seize upon that opportunity by going on offense at the state level—where the far right has wielded power with little to no opposition for decades—we can win. We are winning! And in far more places than we’ve competed for in the past.
That’s what I hoped would happen when I wrote Laboratories of Autocracy. That’s what I described was beginning to happen in Saving Democracy. And that’s what happened Tuesday. From Kentucky to Ohio to Virginia.
Far more on these lessons to come. (I go through them extensively in Saving Democracy.)
The Ohio Results
So what did we see happen in Ohio?
Overall, what we saw was the same multi-partisan coalition that came together to topple the August Issue 1 (the effort to thwart direct democracy) come together again to support reproductive freedom this week.
In some cases, even more dramatically so.
Let me walk through some basic data.
The topline: “Yes on 1” won 56.62% to 43.38% — a margin of more than 500,000 votes.
And how did the state get to that whopping margin?
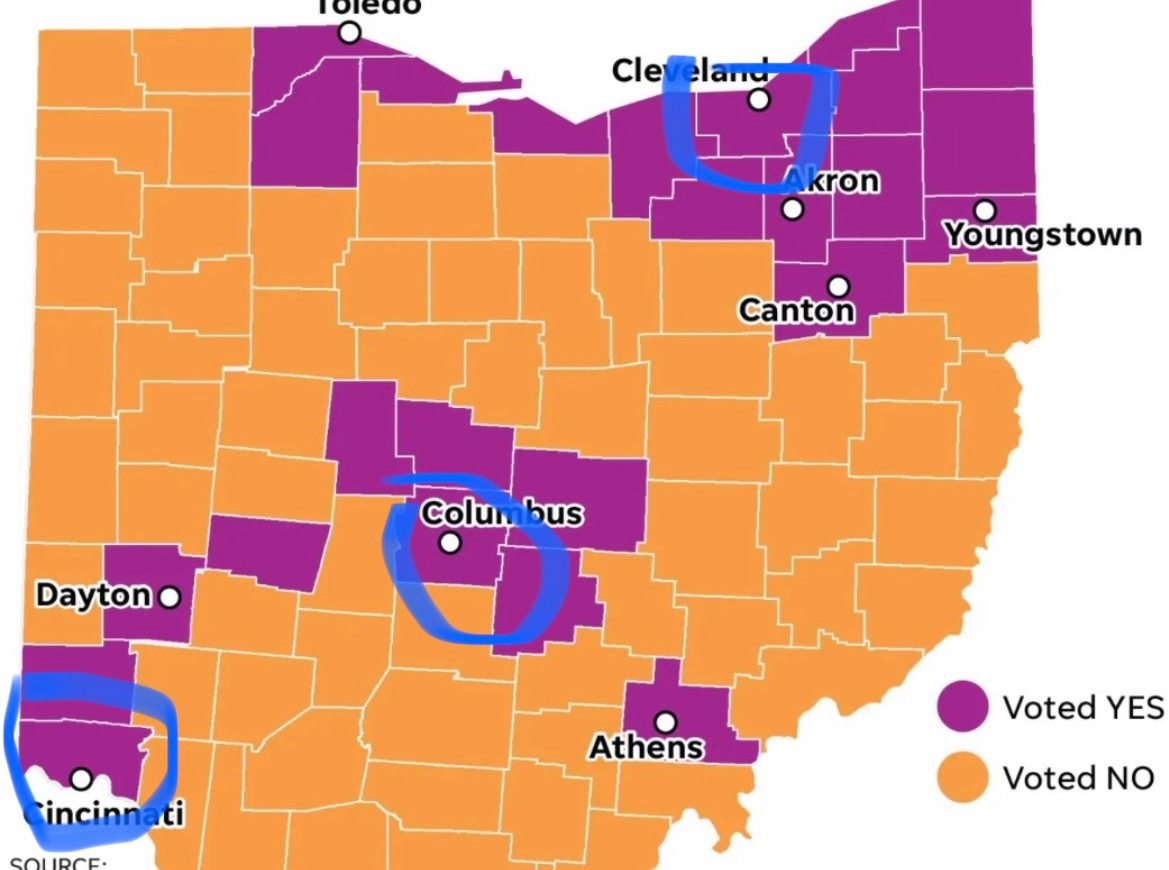
Well, as expected, we saw huge margins in our three largest counties:
Cuyahoga (Cleveland): 74.35%-25.65%
Franklin (Columbus): 72.82%-27.18%
Hamilton (Cincinnati): 64.90%-35.10%
Add these margins up, and Issue 1 had a 440,000 vote lead coming out of those counties. Which is spectacular, right? Yes!
But here’s how stunning Tuesday was. As I said above, Issue 1 won by more than 500,000. Meaning, it would’ve won even without those counties! Now how in the heck did that happen?
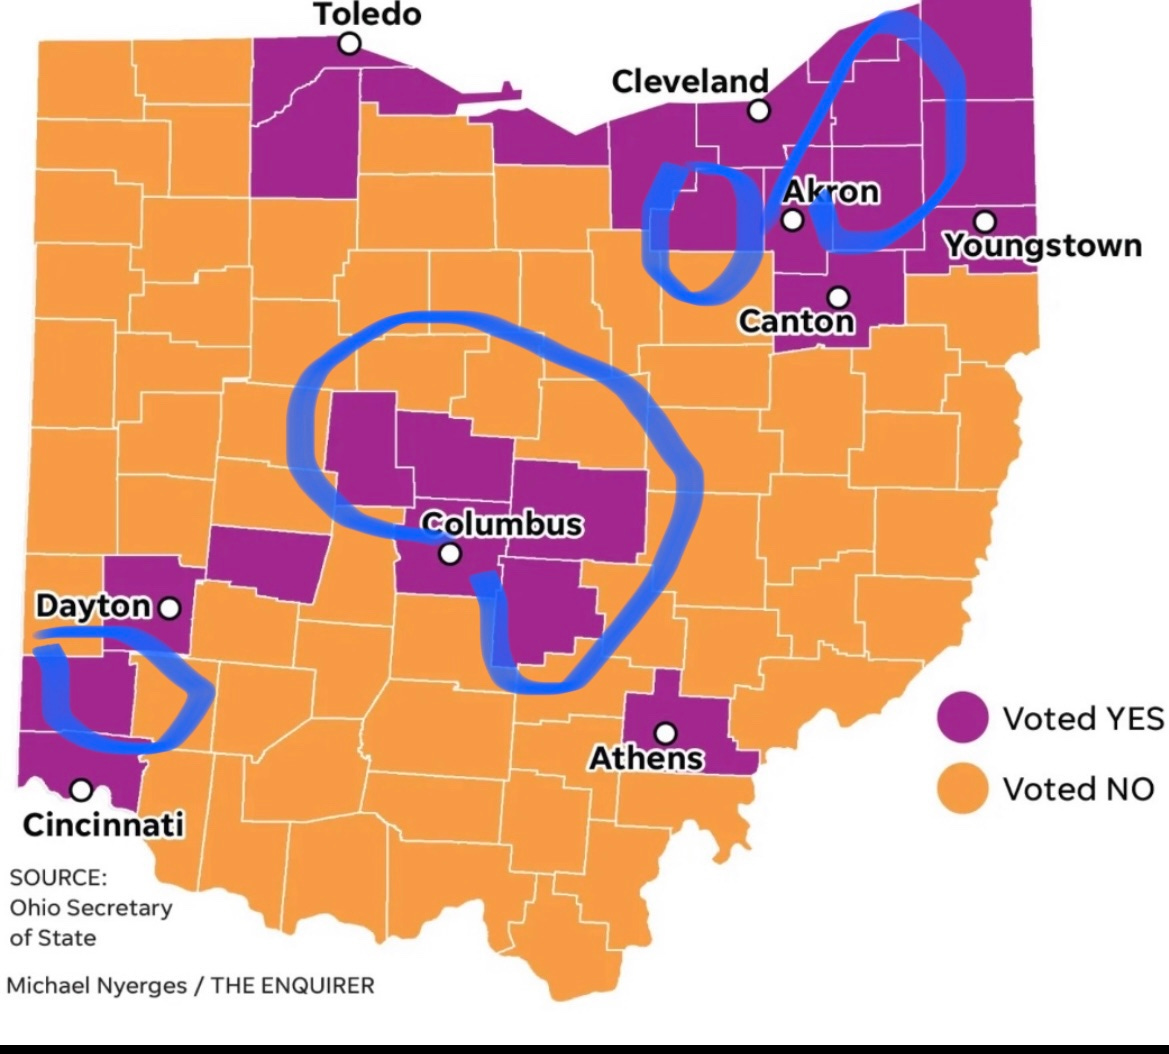
First, while we toppled Issue 1 in August in 22 counties (which was phenomenal), Issue 1 in November won in 25 counties! Welcome aboard Butler, Union, Fairfield, and Licking!
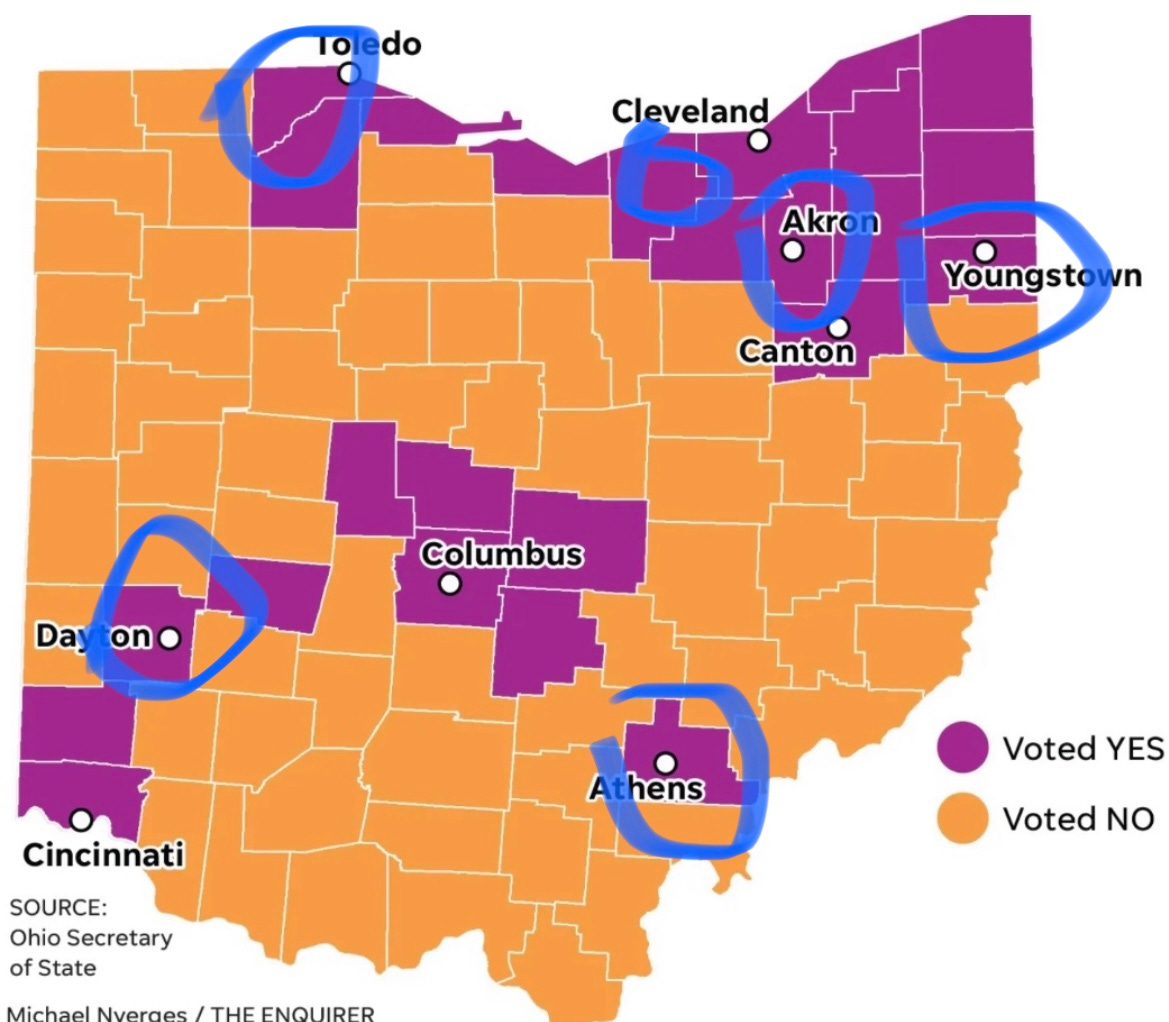
As you’d expect, as in those three large counties, Issue 1 won decisively in Ohio’s other mid-size to large urban counties, which usually vote for Democrats. Here are those (Yes % listed):
Summit (Akron) - whose turnout continues to impress!): 65%
Lucas (Toledo) - 64%
Montgomery (Dayton) - 59%
Mahoning (Youngstown) - 56%
Lorain - 62%
and reliably blue Athens County came in at 72%
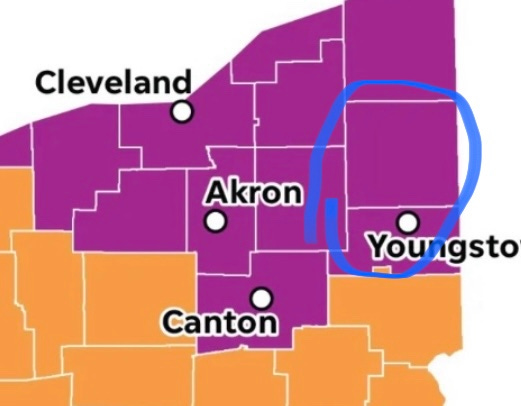
“The Valley,” the Youngstown and Warren area, has been traditionally Democratic, but Democrats have struggled there of late. Mahoning (Youngstown) is above. Trumbull (Warren) voted yes as well - 57%
Nearby Portage County, home of Kent State, voted yes at 61%
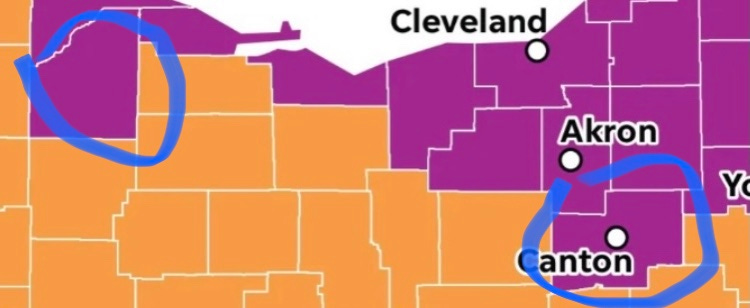
Another group of counties I highlighted in August are the counties that border Lake Erie — they used to be more bellwether counties, but lately, have trended red. Bottom line: if you win these counties, you win Ohio. They all voted No on 1 in August; and they voted all voted “Yes” this week:
Ashtabula - 54%
Lake - 60%
Lorain - 62%
Erie - 57%
Ottawa - 53%
Then there are two counties that used to be the bellwether counties of Ohio (beyond Ottawa)—win them both, and you usually win Ohio:
Wood (Bowling Green) - 55%
Stark (Canton) - 53%
Next up are some truly impressive wins in “collar”/suburban counties that have traditionally provided the largest vote margins for Republican Ohio candidates. Brace yourself—any my guess is these are the losses that truly stunned the statehouse politicians:
Butler - 51%
Delaware - 59%!
Fairfield - 51%
Licking - 51%
Medina - 55%
Geauga - 55%
And then there’s Clark County (Springfield) - 50.48%
So that’s where Issue 1 won. But you don’t only win a state like Ohio by how and where you win, but also by how you lose.
Do the margins in the counties you win add up to overcome the margins of the far more counties you lose? For example, when President Obama lost by only 60-40 or less in numerous GOP counties around the state, those low margins of loss helped secure his overall victory. But in more recent national elections, runaway loss margins—70-30 or worse—in rural and Republican counties were too much to overcome, even as we’ve won the large counties by big margins.
Well, those margins (of loss) are the other story of this week. Because against the decisive winning margins detailed above, “Yes” reached at least 40% in 27 counties of Ohio. Cutting deeply into the margins Republicans usually get in these counties.
Most impressively, “Yes” topped 45% in the following, traditionally Republican counties: Warren (the largest GOP county in Ohio, and usually the largest vote margin), Clermont, Sandusky, Madison, Muskingum, Ross, Tuscarawas, Coshocton, Hocking, and Guernsey.
And “Yes” topped 40% in 18 other counties, all across Ohio: Ashland, Belmont, Champaign, Clinton, Columbiana, Fayette, Hancock, Hardin, Huron, Jefferson, Knox, Morgan, Perry, Pickaway, Richland, Seneca, Washington and Wayne.
Add all these strong “Yes” performances up across traditionally red counties, and there weren’t nearly enough “No” votes around Ohio left to overcome the margins run up in the 25 “Yes” counties.
And that, as they say, was the ballgame.
A couple big-picture takeaways:
As I wrote after August, the maps that were generated from both Issue 1 elections are not simply maps of Democrats vs. Republicans. This is not your typical red vs. blue. They actually tell us far more than that. An even more meaningful story. These are “democracy” maps. “Freedom” maps. They go beyond party. They show us where Ohio Democrats, Independents and Republicans are coming together to reject the extremism on issues, and on democracy, that continues to emerge from a broken and corrupt statehouse. Which means these maps provide the baseline to grow on as we pursue similar issues and reforms—such as ending gerrymandering next year.
These maps are also a reminder that to win Ohio, organizing everywhere matters. Those enormous margins in our large and traditionally Democratic counties are essential to victory. And all the hard work put in to flip red counties, and to reduce margins of loss from being devastating to minimal, is equally essential to winning Ohio. You have to do it all. Thank you to those from around the state who did this work everywhere! (And yes, this is one other confirmation on why it’s so important that we run everywhere).
Speaking of running everywhere, I’ll share my thoughts on next steps in my next newsletter.
In the meantime, savor those maps, and the growing pro-democracy, pro-freedom coalition in Ohio, and America.
You earned it!



Thanks. It might be good to also focus on Rick Santorum's after election comments about "direct democracy is no way to govern" - paraphrasing. I think this "hints" at the MAGA mindset. That is "they don't really believe in democracy" - so the desires of the people don't matter.
I'm encouraged by your analysis, Mr. Pepper, but I'm still perplexed by the map. Why is it that, geographically speaking, 3/4 of Ohioans vote against their best interests? Why is it that all these seemingly good people don't see the train wreck heading their way? I just don't get it.